GPS Water Vapor Images
I am working on using zenith delay measurements from fixed GPS
receivers to generate precipitable water images for California and
Nevada. This technique is in use by other groups but the great
thing about California and Nevada is that there are so many GPS sites
that high-resolution images are possible. The trick is that you
need the station pressure at the GPS site when the delay is measured
and most of these sites don't have barometers. For historical
images I'm interpolating North American Regional Reanalysis (NARR) data
to get the pressure. In the future I may be able to make near
realtime images by using the Rapid Update Cycle (RUC) analysis to
generate the station pressures.
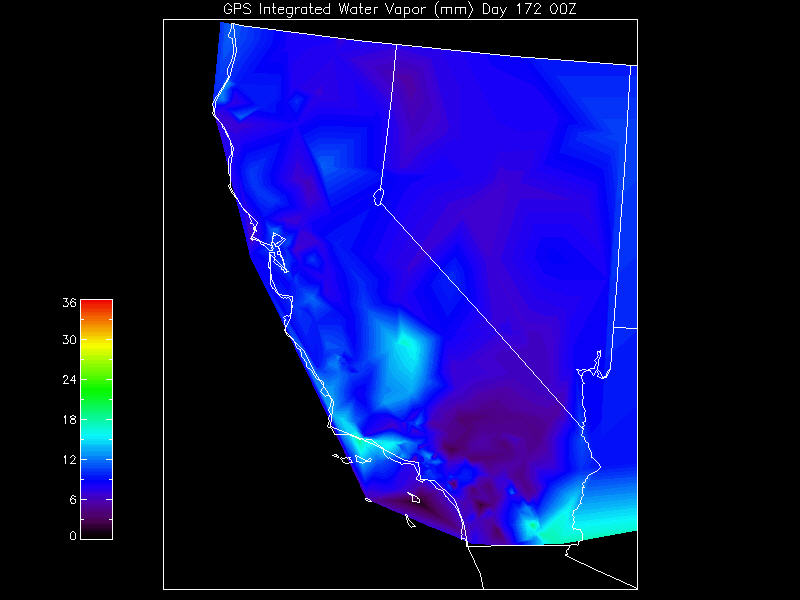
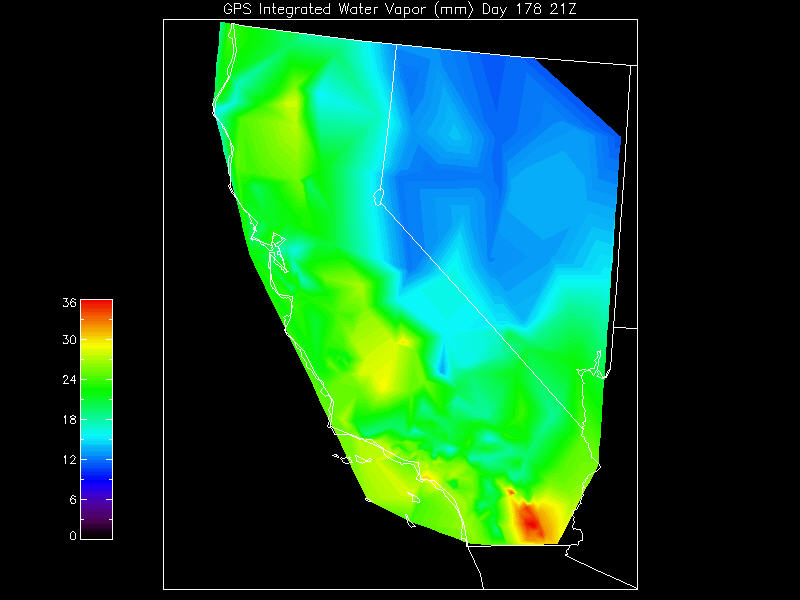
You can see my first attempts at this sort of image below. The
two images show precipitable water for California on days one week
apart in June of 2006. You can clearly see the difference in how
moist the airmass is. Below the images there is a link to an
animation of this week, with frames every 3 hours. You can clearly see
the increase in moisture during the week, more or less spreading from
south/southeast. It is not monotonic, though, for perhaps many
reasons.


Download 2006 summer monsoon onset
animation (3MB)
Here is another animation, this time of an "atmospheric river" event
from January 6-12, 2005
Download January 6-12 2005 atmospheric river
animation (7
MB)

